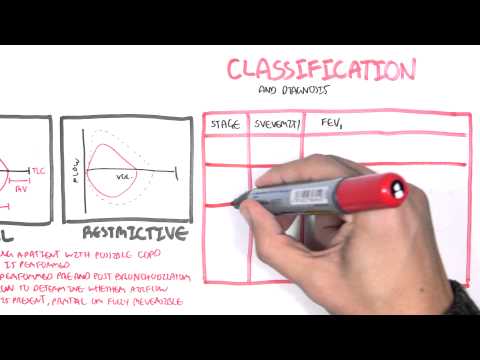
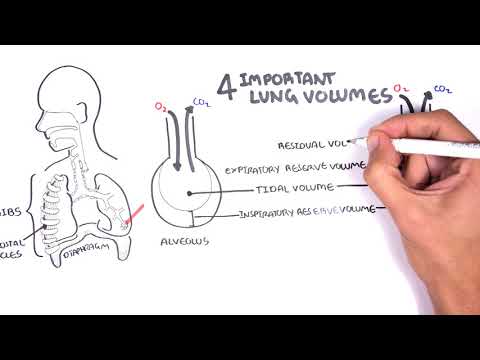
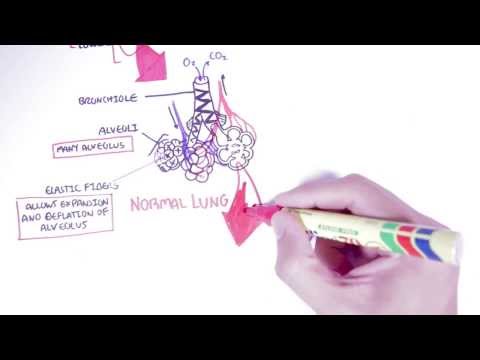
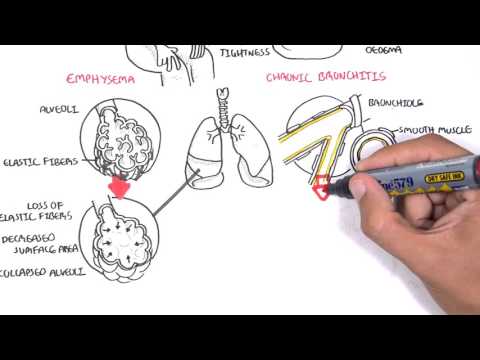
0:00 In this video, we're going to look at spirometry and look at the differences 0:08 between normal, 0:10 obstructive pulmonary disease, and also restrictive lung disease. 0:13 It is a good idea to recap the lung volumes and lung capacities before looking 0:19 into this 0:19 video. 0:21 So one way to monitor lung function is by using a lung function test, such as a 0:27 spirometry. 0:28 If we breathe in and out normally in this lung volume measuring device, we can 0:32 see our 0:33 tidal volume, which is typically 500 mils or 0.5 liters. 0:38 The graph here, the x-axis you can say is just the time, and on the y-axis is 0:44 the lung 0:45 volume. 0:47 So going up the y-axis is inspiration. 0:50 The lung volume will increase when we inspire air in. 0:54 And going down the y-axis is expiration, the lung volume will decrease when we 0:58 breathe 0:59 out, obviously. 1:01 So now imagine taking a maximal deep breath in. 1:05 This is the inspiratory reserve volume, also known as IRV. 1:11 And now imagine taking a normal breath or normal breaths and then having a 1:17 maximal expiration. 1:19 This is your expiratory reserve volume or IRV. 1:25 And the air remaining in your lungs after the maximal expiration is the 1:30 residual volume 1:31 or IRV. 1:33 You just always have that there. 1:36 Using these lung volumes, you can measure the lung capacities. 1:40 The lung capacities help define functioning lungs. 1:45 The vital lung capacity refers to the maximum amount of air expired from a 1:50 fully inflated 1:51 lung. 1:52 This means it's the tidal volume, TV, plus the inspiratory reserve volume plus 1:57 the expiratory 1:57 reserve volume. 2:00 The functional residual capacity, which should not be mixed up with the 2:03 residual volume, represents 2:04 the volume of air remaining in the lungs after expiration of a normal breath. 2:12 So it's residual volume plus expiratory reserve volume. 2:17 Very important is also the total lung capacity, which is the sum of all the 2:21 lung volumes. 2:22 In a typical adult male, it's about six liters. 2:26 We will use a typical adult male total lung capacity as an example in the 2:32 following scenarios. 2:34 So this first graph represents a normal lung. 2:39 They're coming in and carbon dioxide coming out. 2:41 The LVOI are inflating and deflating normally. 2:47 Dynamic measurements of lung volumes and capacities have been used to help 2:52 determine lung dysfunction. 2:54 The vital capacity is really important to remember. 2:58 Again, it's the tidal volume plus the inspiratory reserve volume plus the expir 3:02 atory reserve 3:02 volume. 3:04 The forced vital capacity is basically the same thing as the vital capacity, 3:10 but by definition, 3:12 it is the largest amount of air that can be expired after a maximal inspiratory 3:17 effort. 3:18 So you breathe very deep in and then you breathe out fully. 3:25 The forced vital capacity is frequently measured clinically as an index of 3:30 pulmonary function. 3:32 It gives useful information about the strength of the respiratory muscles and 3:37 other aspects 3:37 of pulmonary function. 3:40 Let us draw it in a graph of a normal lung. 3:42 Here you have the volume on the x-axis and flow through the lung on the y. 3:52 So a normal adult has a total lung capacity of six liters. 3:56 So here is the volume set here at six liters. 4:00 So from zero to six is a total lung capacity. 4:06 The forced vital capacity, FVC, is again the largest amount of air that can be 4:12 expired 4:13 after you take the maximal breath in. 4:18 Disperometry helps document and measure all this. 4:21 So imagine taking a deep breath in and then exhaling it out as forcefully and 4:27 as quickly 4:28 as you can. 4:30 You can thus say this is your vital capacity or forced vital capacity which in 4:36 reality 4:37 is your total volume plus your inspiratory reserve volume plus your expiratory 4:42 reserve 4:42 volume. 4:44 Thus the remaining air in our lungs after a maximal expiration if you remember 4:49 is your 4:49 residual volume. 4:53 You can look at the forced vital capacity on a different graph by also 4:59 introducing time. 5:01 When we introduce time we can calculate another component. 5:05 Here we are looking at time on the x-axis in seconds 1, 2, 3, 4, 5, 6, 7, 8, 9, 5:12 10. 5:13 And then on the y-axis is the volume of air in the lungs in liters. 5:17 So three liters here and six liters. 5:19 Here six liters is the total lung capacity in an adult male. 5:25 Here is the volume of air expired by a normal adult man during a forced 5:32 expiration after 5:34 a deep inspiration which again is your forced vital capacity. 5:39 And here it's about five liters and this again is your forced vital capacity. 5:46 Thus again the air volume remaining in the lungs after maximal forced 5:51 expiration is 5:52 your residual volume. 5:56 Now this is important concept, see if you can follow. 6:00 The fraction of the vital capacity expired during the first second of a forced 6:07 expiration 6:08 is referred to as the forced expiratory volume or FEV1. 6:16 So from the graph the forced expiratory volume in the first second FEV1 to the 6:24 forced vital 6:25 capacity FVC ratio can be calculated. 6:31 Four liters divided by five liters which is 0.8 or 80 percent. 6:36 And again this is normal. 6:38 We will look at how this changes with certain diseases. 6:42 So let's look at what happens in COPD where we have gas trapping and we have 6:47 obstruction 6:47 of the airways. 6:49 Many changes are seen in lung volume and lung capacities. 6:53 In obstructive airway disease, straight away we can see an increase in total 6:58 lung capacity. 6:59 This is why it is common to see features of an enlarged chest in patients with 7:05 COPD. 7:05 The tidal volume remains the same however the inspiratory reserve volume 7:10 decreases. 7:11 The expiratory reserve volume increases and the residual volume increases as 7:18 well. 7:18 Thus if we were to calculate the lung capacities, the vital capacity or also we 7:24 can straight 7:26 away say the forced vital capacity is the same or may be decreased. 7:34 The functional residual capacity is increased and the total lung capacity as 7:39 mentioned 7:39 altogether increases. 7:42 The reason behind these changes in lung volume and capacities are two main 7:47 things. 7:48 Firstly the reduction in air flow to the lungs due to obstruction. 7:55 And then you have what's called air trapping. 7:57 The air remains in the lungs at expiration. 8:01 As a consequence, you get hyperinflation and consequently an increase in your 8:06 functional 8:07 residual capacity. 8:11 Now let's see this using a spirometry and compare it to the normal on the left 8:16 side. 8:17 Again here we have the graph with volume in liters on the x axis and flow of 8:22 air through 8:22 the lungs on the y axis. 8:25 The forced vital capacity FVC again is the largest amount of air that can be 8:31 expired 8:31 after maximal inspiratory effort. 8:34 Here in the dotted black line is normal force vital capacity. 8:39 Normal full inspiration and then normal full expiration. 8:46 And this is obstructive lung disease. 8:49 The whole graph shifts to the left because you have an increase in residual 8:54 volume. 8:55 And an increase in total lung capacity more than six liters. 9:00 Your vital capacity or forced vital capacity you can say remains the same. 9:06 But all up your total lung capacity has increased because of the increase in 9:10 your residual volume 9:11 or better because of the increase in your functional residual capacity. 9:17 You can see here the characteristic kink in the obstructive lung disease 9:22 patient during 9:23 forced expiration. 9:24 This is because of the obstruction and also the flow decreases slightly because 9:30 of the 9:30 obstruction through the airways. 9:35 Let's see what the first second of a forced expiration is using the graph 9:41 looking at time 9:43 and volume on the y axis. 9:47 Again to compare this to normal force vital capacity. 9:51 This is obstructive lung disease. 9:54 We can see that the forced vital capacity is the same or slightly decreased. 10:01 The forced expiratory volume in the first second has dropped significantly. 10:09 Obstructive lung disease can be diagnosed when the ratio between FEV1 and FVC 10:14 is less 10:14 than 0.7 or 70%. 10:18 And so in this example FEV1 is about 1 liter and the FVC is about 5 liters and 10:24 so 1 divided 10:25 by 5 is obviously less than 0.7 or less than 70% and thus this is an example of 10:33 a person 10:34 who has obstructive lung disease. 10:36 Finally, let's look at restrictive lung disease. 10:39 These conditions include pneumoconiosis, sarcoidosis, amongst many other things 10:47 . 10:47 In restrictive lung disease you have restriction like fibrosis in the lungs 10:51 which impair lung 10:52 compliance. 10:53 So the total volume remains the same but you have all this restriction in the 10:57 lung, all 10:58 this fibrosis and so your inspiratory reserve volume is reduced and your expir 11:03 atory reserve 11:04 volume is reduced and your residual volume is reduced as well. 11:10 Everything is reduced. 11:11 Thus, your forced vital capacity is reduced. 11:14 The functional residual capacity is reduced and surprisingly your total lung 11:19 capacity 11:19 is reduced. 11:21 The reason for this again is because of pulmonary fibrosis or changes in the 11:24 lungs that lead 11:25 to restriction and lung compliance. 11:28 You get stiffness, restriction and because of this stiffness you have reduction 11:33 in lung 11:33 volumes and lung capacities. 11:39 Let's look at your forced vital capacity using a graph again. 11:43 The dotted black line represents normal forced vital capacity which is the 11:47 largest amount 11:48 of air that can be expired after a maximal inspiratory effort. 11:54 Here in brown is the pattern of forced vital capacity seen in restrictive lung 11:59 disease. 11:59 As you can see it has shifted to the right. 12:01 The reason for this shift and change is because firstly your total lung 12:06 capacity has reduced 12:07 because of the restrictive lung changes. 12:10 The residual volume has reduced and so it is no surprise your vital capacity or 12:18 forced 12:19 vital capacity is reduced. 12:25 What about the forced expiratory volume in the first second? 12:29 Let's look at the other graph again at time on the x axis. 12:32 So 1, 2, 3, 4, 5, 6, 7, 8, 9, 10 seconds and lung volume on the y which again 12:38 in a normal 12:39 adult male goes up to 6 litres. 12:41 A normal person shoots up and the forced vital capacity goes up to about 5 12:48 litres. 12:49 In restrictive here however in brown you can see that the forced vital capacity 12:54 has reduced 12:54 dramatically but the forced expiratory volume in one second is not as affected. 13:04 The forced expiratory volume in one second FEV1 in restrictive lung disease is 13:08 not as 13:09 affected as seen in patients who have COPD or obstructive lung disease. 13:15 It can be normal actually in these patients who have restrictive lung disease 13:19 or reduced 13:20 depending on the severity and if the person has obstructive lung disease too. 13:25 The FEV1 to FVC ratio is a useful tool in recognising severity of area disease 13:31 and can 13:31 help differentiate between COPD and restrictive lung disease. 13:36 In restrictive lung disease the FEV to FVC ratio is not as affected. 13:42 So for example in this scenario of restrictive lung disease the FEV1 is about 3 13:48 litres and 13:49 the forced vital capacity is about 4 litres. 13:53 So 3 divided by 4 is 0.75 or 75% and thus this can constitute restrictive lung 14:01 disease rather 14:01 than obstructive airway disease. 14:05 Hope this video makes sense and hope it was helpful.