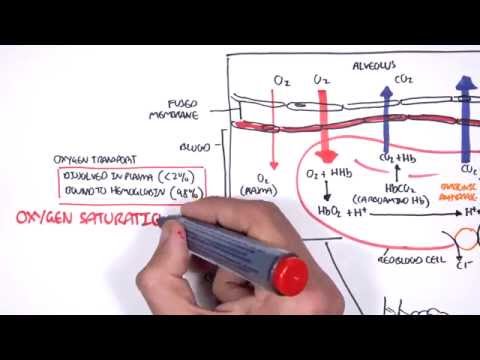
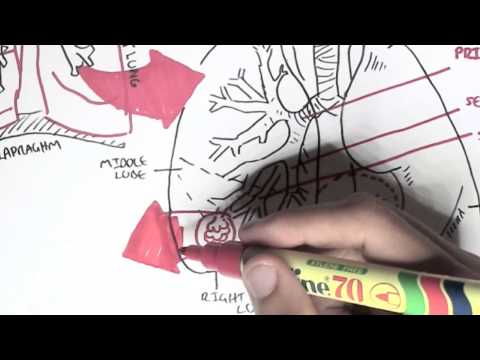
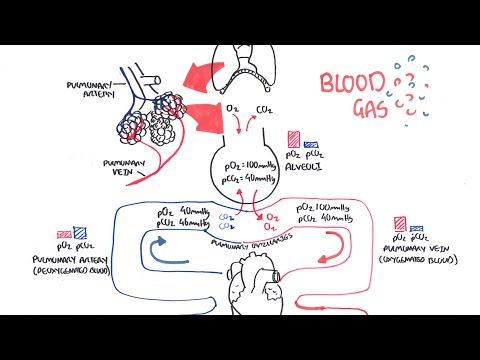
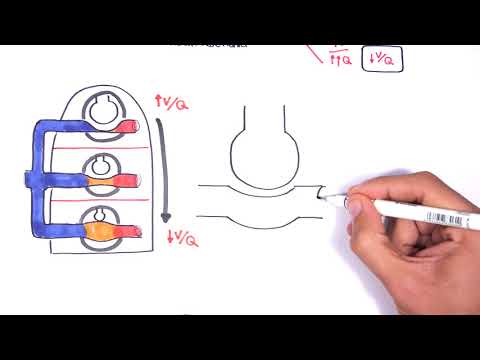
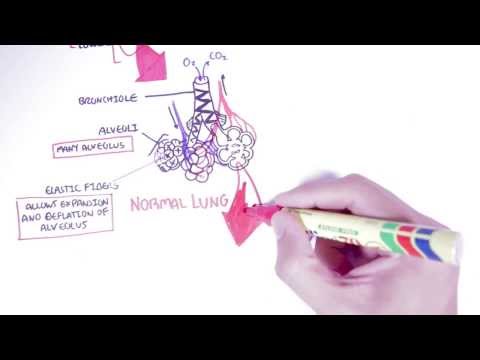
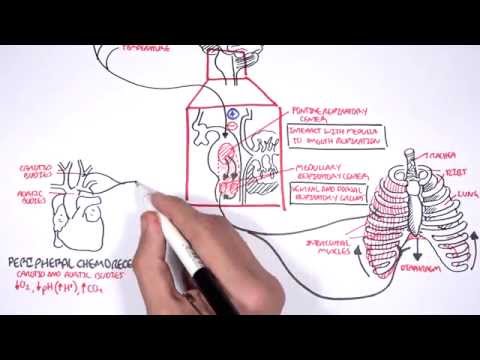
0:00 Hello, in this video we're going to focus on lung physiology, focusing on gases 0:09 and 0:09 pH. 0:10 We'll also look at the oxygen dissociation curve. 0:15 So air enters the respiratory system in the upper airways, proceeds to the 0:19 conducting 0:20 airways, and then onto the respiratory airway made up of the branches of the 0:24 bronchi, bronchioles, 0:25 terminal bronchioles, and finally ends in the alveoli. 0:29 You can think of the alveolus, which is singular of alveoli, as the building 0:35 blocks of the 0:36 lungs, where gas exchange occurs, gas exchange occurring between the lungs and 0:42 the bloodstream. 0:43 The gas exchange, in this case, is between oxygen and carbon dioxide, or CO2. 0:49 So just recapping the basic physiology. 0:52 The heart will pump deoxygenated blood from the right ventricle towards the 0:58 lungs. 0:59 Deoxygenated blood means blood containing a higher concentration of CO2 with 1:04 lower amounts 1:04 of oxygen. 1:07 In each alveolus, the carbon dioxide will be dropped off and exhaled out of the 1:13 body, 1:14 so removing carbon dioxide from a body. 1:16 And then oxygen will be inhaled and will then reoxygenate the blood. 1:21 This newly oxygenated blood, or reoxygenated blood, will then go back to the 1:27 left side 1:28 of the heart. 1:31 The heart will then pump this oxygenated blood around the body to the other 1:36 organs, such 1:36 as the brain. 1:39 The oxygenated blood delivers oxygen to organs, tissues. 1:43 The organ tissues then uses up this oxygen to help create energy in the form of 1:51 ATP. 1:52 Now as a process of creating this energy, ATP, the organs, the tissues will 1:58 form a byproduct, 2:00 which is carbon dioxide. 2:03 Carbon dioxide is then made and is actually expelled into the bloodstream, as 2:09 exchange 2:09 you can say. 2:12 Now because carbon dioxide is in the bloodstream, the blood is now deoxygenated 2:17 once again. 2:18 And this deoxygenated blood will return to the right side of the heart. 2:23 The right side of the heart will continue the cycle, it will pump blood to the 2:27 lungs 2:27 to reoxygenate the blood. 2:31 Oxygen itself travels in the body mainly in red blood cells. 2:36 Oxygen binds to these molecules called hemoglobin, and we have millions of 2:40 these in each red 2:41 blood cell. 2:43 In deoxygenated blood, with deoxygenated hemoglobin or deoxy hemoglobin, the 2:50 structure of hemoglobin 2:52 here is referred to as a tight structure. 2:59 Hemoglobin, just recapping, is a protein made up of four subunits, each of 3:04 which contain 3:05 a hemoidy attached to a globin chain. 3:09 And each globin chain contains iron, where oxygen normally binds to. 3:15 Each of the four iron atoms in hemoglobin can reversibly bind one oxygen 3:23 molecule. 3:25 Let's see what happens when deoxy hemoglobin receives oxygen. 3:29 Well, the reaction is rapid, requiring less than 0.01 seconds. 3:37 Or in deoxy hemoglobin, the globin units are tightly bound in a tense 3:42 configuration in 3:44 a T configuration, which means that it actually reduces the affinity of the 3:50 molecule for oxygen. 3:52 When oxygen is first bound, the bonds holding the globin units are released, 3:58 producing a 3:59 relaxed configuration, or an R configuration, which exposes more oxygen binding 4:06 sites. 4:07 So to put it simply, you can imagine it like a cascade. 4:11 Firstly, the hemoglobin is in a tense configuration, with no oxygen. 4:17 And then when oxygen starts to bind, it will become more relaxed, a relaxed 4:21 configuration, 4:22 which actually increases the affinity for oxygen even more, kind of weird. 4:28 This whole thing is called positive cooperativity. 4:32 So by the end, the hemoglobin molecule is an oxy hemoglobin, because it is 4:37 filled with 4:38 oxygen, and it is in a relaxed form. 4:42 So from the lungs, you now have heaps of oxy hemoglobin, which means your blood 4:47 is 4:48 reoxygenated, really. 4:50 And this reoxygenated blood is ready to be delivered to the body tissues. 4:55 It's a good idea now to briefly talk about partial pressures of oxygen and 4:59 carbon dioxide 5:00 in deoxygenated blood, and also in oxygenated blood. 5:05 Because it will be relevant to what we will talk about later. 5:09 Now you can imagine that when blood is oxygenated, or reoxygenated from the 5:14 lungs, it would 5:16 have a higher partial pressure of oxygen, so higher amounts of oxygen, 100. 5:23 And carbon dioxide is low, 40. 5:26 The oxygenated blood I am talking about are found in your arteries, such as 5:31 your aorta. 5:32 Deoxygenated blood on the other hand is very different. 5:34 When we talk about deoxygenated blood, we are talking about the veins. 5:38 So oxygen can be up to 40 millimeters mercury. 5:45 And carbon dioxide, about 45. 5:48 The changes in partial pressure is important to understand because it helps 5:53 explain the 5:54 hemoglobin dissociation curve. 5:57 And we will talk about that now. 6:00 The hemoglobin dissociation curve or the oxygen hemoglobin dissociation curve 6:05 relates a percentage 6:07 saturation of the oxygen carrying power of hemoglobin to the partial pressure 6:13 of oxygen. 6:14 Now that might sound crazy, but let's just try to understand it together. 6:20 So in the x-axis, you have the partial pressure of oxygen, 25 to 100 mill 6:24 imeters mercury. 6:26 And on the y-axis, you have the saturation of hemoglobin, which is what we are 6:31 looking 6:31 at specifically as oxyhemoglobin in percentage. 6:36 This saturation of oxyhemoglobin means how much oxygen is bound to the hem 6:43 oglobin basically. 6:45 The more oxygen bound to hemoglobin, the higher the oxyhemoglobin and therefore 6:50 the higher 6:50 the saturation. 6:53 So the oxygen hemoglobin dissociation curve has a characteristic zig-moin shape 6:59 due to 7:00 the tense and relaxed configuration interconversion. 7:06 There is a plateau here where the partial pressure of oxygen is nearly high. 7:14 The plateau signifies that high partial pressure of oxygen does not cause large 7:21 changes in 7:22 oxygen saturation of hemoglobin. 7:27 So at the plateau, you can see that the partial pressure of oxygen of 100 7:31 already has an oxygen 7:32 saturation of 98%, so there is not much change. 7:38 Whereas before the plateau, so a partial pressure of oxygen of 50, let's just 7:43 say, already 7:43 has an oxygen saturation of 85%, so a dramatic change. 7:48 So note that small changes at low partial oxygen pressure leads to large trade 7:55 changes 7:56 in oxygen saturation. 7:58 Another example is that a low partial pressure of oxygen such as 26 has already 8:04 an oxygen 8:05 saturation of 50%. 8:08 The reason for this zig-moin shape and why low partial pressure of oxygen has a 8:14 quick 8:15 increase in oxygen saturation is because of positive cooperativity. 8:22 And the first hem in the hemoglobin molecule receives oxygen, the affinity 8:26 increases for 8:27 the second and then the third and so on. 8:32 Now let's look at factors which can shift this curve, which are essentially 8:36 factors affecting 8:37 the affinity of hemoglobin for oxygen. 8:41 Three important conditions affect the oxygen hemoglobin dissociation curve. 8:47 These are the pH, the temperature and the concentration of 2, 3 dye phosphogly 8:53 cerate 8:53 or DPG. 8:57 Here is the curve normally. 8:59 We will look at examples of what shifts the curve to the right and what shifts 9:03 the curve 9:03 to the left. 9:05 When the curve shifts to the right, it means that there is reduced hemoglobin 9:11 oxygen affinity. 9:14 And this occurs in tissues, so basically the hemoglobin affinity for oxygen is 9:23 decreased. 9:24 Remember the normal curve, the partial pressure of oxygen of 50 had an oxygen 9:29 saturation of 9:30 about 83 to 85%. 9:33 In this new curve, the partial pressure of oxygen of 50 has an oxygen 9:38 saturation of 70%, 9:40 so reduced oxygen saturation, and this is because there is reduced affinity for 9:46 oxygen. 9:47 Things that cause this to happen include an increase in carbon dioxide, which 9:50 really means 9:51 a decrease in pH. 9:53 Other things that causes the shift to happen include an increase in temperature 9:57 and an 9:58 increase in DPG or BPG. 10:01 It's good to remember that the reduced hemoglobin oxygen affinity occurs in 10:07 tissues in general, 10:09 because when you think about it, you want to give your oxygen to the body 10:12 tissues so 10:12 that they can use it. 10:14 These tissues include the placenta because you want to offload oxygen to the 10:18 fetus and 10:19 muscles, especially during exercise. 10:23 Now the curve can also shift to the left here in red. 10:27 What happens here is that we see higher hemoglobin oxygen affinity. 10:34 And for this example, you can think of the lungs because it is in the lungs 10:37 where oxygen 10:37 comes and binds to hemoglobin, and so you would expect to see higher hemoglobin 10:42 oxygen 10:43 affinity here. 10:44 Later, when the blood travels to the body tissues such as the muscles, the 10:48 affinity 10:48 reduces as we have learned. 10:51 The other factors which contribute to the high hemoglobin oxygen affinity, so 10:55 this red 10:56 curve, are reduced carbon dioxide, which means higher pH, reduced temperature, 11:03 and 11:03 also reduced DPG, which is essentially opposite to the curve when it shifts to 11:10 the right. 11:11 So let's compare now, in this red curve, so a high hemoglobin oxygen affinity, 11:17 if the 11:18 person has a partial pressure of oxygen of 50, the oxygen saturation is already 11:26 90%. 11:27 So in this video, we talked about how oxygen binds onto hemoglobin from a deoxy 11:31 genated 11:32 state in a tense configuration into a relaxed R configuration. 11:37 And we also talked about the oxygen dissociation curve and factors which cause 11:41 the curve to 11:42 shift to the right, as well as factors which cause the curve to shift to the 11:46 left. 11:47 Hope it made sense. 11:48 Thank you for watching.